The histogram below shows the distribution of the assets (in millions of dollars) of 71 companies. Does the distribution appear to be normal? 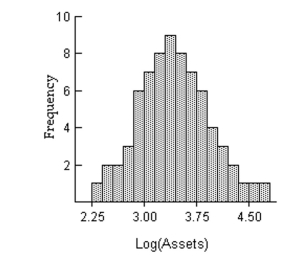
Correct Answer:
Verified
View Answer
Unlock this answer now
Get Access to more Verified Answers free of charge
Q31: The frequency table below shows the
Q32: Construct a frequency distribution that includes an
Q33: Use the given paired data to
Q35: Solve the problem.
-Suppose that you construct a
Q36: Consider the frequency distribution below, which
Q37: Suppose that a data set has a
Q38: Use the given data to construct
Q39: Consider the frequency distribution below, which
Q40: Solve the problem.
-Construct a frequency distribution and
Q40:
Unlock this Answer For Free Now!
View this answer and more for free by performing one of the following actions

Scan the QR code to install the App and get 2 free unlocks

Unlock quizzes for free by uploading documents