The following graph shows the populations of the metropolitan areas of City X and City Y over six years. 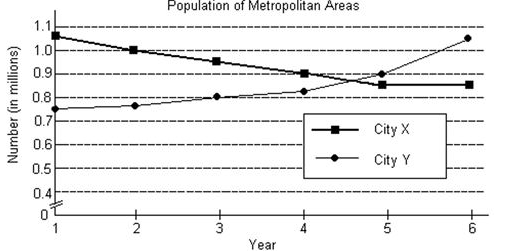
-If equations of the form y = f(t) were determined that modeled either of the two graphs, then the variable t would represent _______ and the variable y would represent _______.
A) population (in millions) ; year
B) City Y; City X
C) City X; City Y
D) year; population (in millions)
Correct Answer:
Verified
Q6: Solve the system by substitution.
-
Q7: Solve the system by substitution.
-
Q8: Solve the system by substitution.
-
Q9: Solve the system by elimination.
-
Q10: Solve the system by elimination.
-
Q12: Solve the system by elimination.
-
Q13: The following graph shows the populations of
Q14: Solve the system by elimination.
-
Q15: Solve the system by elimination.
-
Q16: Solve the system by substitution.
-
Unlock this Answer For Free Now!
View this answer and more for free by performing one of the following actions

Scan the QR code to install the App and get 2 free unlocks

Unlock quizzes for free by uploading documents