Construct a pie chart representing the given data set.
- 
A) 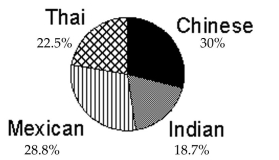
B) 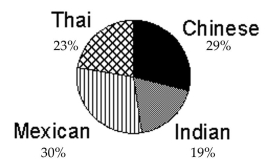
C) 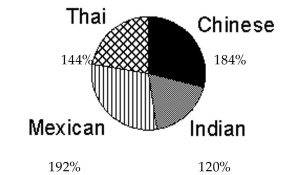
D) 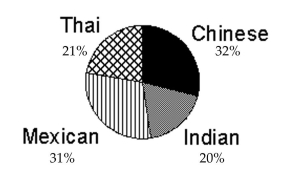
Correct Answer:
Verified
Q217: Use the guidelines to evaluate the study.
Q218: Solve the problem.
-For the study described below,
Q219: Construct a pie chart representing the
Q220: Identify the variable as either qualitative
Q221: Use the guidelines to evaluate the study.
Q223: Use the guidelines to evaluate the study.
Q224: Make a scatter diagram for the
Q225: Identify which of these types of sampling
Q226: Identify the variable as either qualitative or
Q227: Identify the variable as either qualitative or
Unlock this Answer For Free Now!
View this answer and more for free by performing one of the following actions

Scan the QR code to install the App and get 2 free unlocks

Unlock quizzes for free by uploading documents