Make a scatter diagram for the data.
-The table shows the life expectancy at birth for females and per capita GDP for nine countries. (Data for 1995) Plot per capita GDP on the horizontal axis and life expectancy on the vertical axis. 
A) 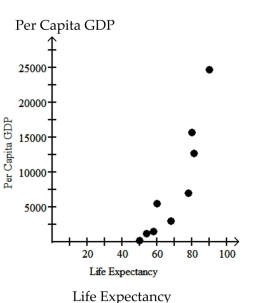
B) 
C) 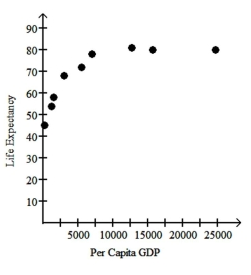
D) 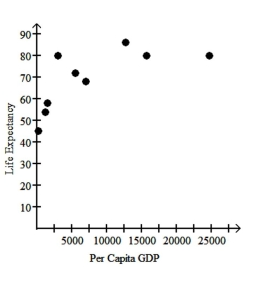
Correct Answer:
Verified
Q219: Construct a pie chart representing the
Q220: Identify the variable as either qualitative
Q221: Use the guidelines to evaluate the study.
Q222: Construct a pie chart representing the
Q223: Use the guidelines to evaluate the study.
Q225: Identify which of these types of sampling
Q226: Identify the variable as either qualitative or
Q227: Identify the variable as either qualitative or
Q228: Identify which of these types of sampling
Q229: The stack plot below shows the value
Unlock this Answer For Free Now!
View this answer and more for free by performing one of the following actions

Scan the QR code to install the App and get 2 free unlocks

Unlock quizzes for free by uploading documents