Construct a line chart for the data.
-The table shows the price of a volatile stock from the months January through December of the same year as determined by the closing price on the last trading day of the month. The price is
Rounded to the nearest dollar. 
A) 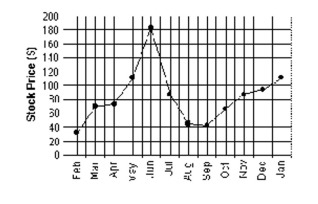
B) 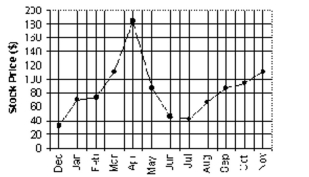
C) 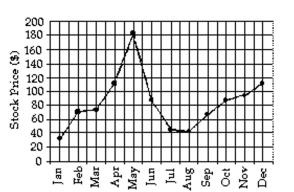
D) None of the above
Correct Answer:
Verified
Q193: A statement is made about correlation. State
Q194: Identify which of these types of sampling
Q195: Identify which of these types of sampling
Q196: Answer the question.
-What name is given to
Q197: A statement is made about correlation. State
Q199: A statement is made about correlation. State
Q200: State whether you think that the variables
Q201: State whether you think that the variables
Q202: Identify which of these types of sampling
Q203: Identify the variable as either qualitative or
Unlock this Answer For Free Now!
View this answer and more for free by performing one of the following actions

Scan the QR code to install the App and get 2 free unlocks

Unlock quizzes for free by uploading documents