Use the graph to answer the question.
-This double-bar graph shows the number of male (M) and female (F) athletes at a university over a four-year Period. 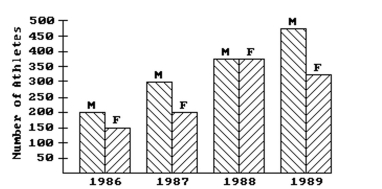
Compare the trend in the number of male athletes during the four-year period and the trend in the number of Female athletes during the four-year period .
A) The number of male athletes increased steadily over the four-year period. The number of female athletes increased in 1987 then decreased again in 1988 and 1989.
B) The number of male athletes and the number of female athletes increased steadily over the four-year period.
C) The number of female athletes increased steadily over the four-year period. The number of male athletes increased to a peak in 1988 and then decreased again in 1989.
D) The number of male athletes increased steadily over the four-year period. The number of female athletes increased to a peak in 1988 and then decreased again in 1989.
Correct Answer:
Verified
Q79: Solve the problem.
-Use the high closing
Q80: The stem-and-leaf diagram below shows the
Q81: Answer the question using the graphical display.
Q82: Answer the question using the graphical display.
Q83: Answer the question using the graphical display.
Q85: The stacked line chart shows the value
Q86: Use the graph to answer the question.
-
Q87: Answer the question using the graphical display.
Q88: The stacked line chart shows the value
Q89: Answer the question using the graphical display.
Unlock this Answer For Free Now!
View this answer and more for free by performing one of the following actions

Scan the QR code to install the App and get 2 free unlocks

Unlock quizzes for free by uploading documents