Answer the question using the graphical display. 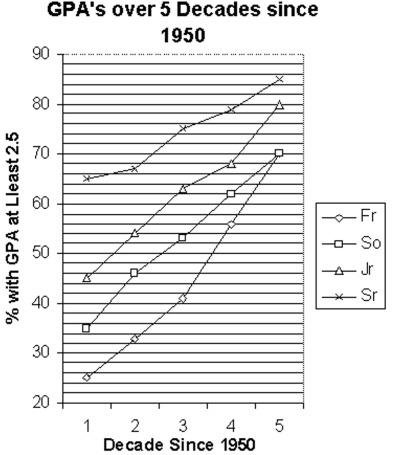
-Determine the percentage increase in sophomore 2.5 or better GPA's over the five decades.
A) 40%
B) 50%
C) 34%
D) 30%
Correct Answer:
Verified
Q95: The stacked line chart shows the value
Q96: The stacked line chart shows the value
Q97: Use the graph to answer the question.
-
Q98: Answer the question using the graphical display.
Q99: The stacked line chart shows the value
Q101: Create a graphical display for the
Q102: Create a graphical display for the
Q103: The bar graph below shows the average
Q104: A television manufacturer sold three times as
Q105: The graph below shows the approximate annual
Unlock this Answer For Free Now!
View this answer and more for free by performing one of the following actions

Scan the QR code to install the App and get 2 free unlocks

Unlock quizzes for free by uploading documents