Solve the problem. Round your answers to the nearest whole percent.
- The scatter diagram shows the data for price per item (y) and the availability of that item (x) . The correlation coefficient r
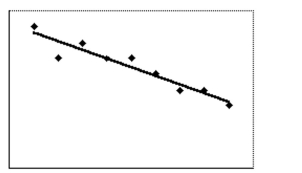
Is -0.95. Determine how much of the variation in price per item can be accounted for by the best-fit line.
A) 5%
B) 10%
C) 95%
D) 90%
Correct Answer:
Verified
Q45: Solve the problem.
-There is a strong correlation
Q46: Solve the problem.
-A local highway has an
Q47: Answer the question using the value of
Q48: Solve the problem.
-A study found a strong
Q49: Solve the problem.
-A reporter studied the causes
Q50: Answer the question using the value of
Q51: Answer the question using the value of
Q52: Determine whether the stated causal connection is
Q54: Determine whether the stated causal connection is
Q55: Answer the question using the value of
Unlock this Answer For Free Now!
View this answer and more for free by performing one of the following actions

Scan the QR code to install the App and get 2 free unlocks

Unlock quizzes for free by uploading documents