Answer the question using the value of r and the given best-fit line on the scatter diagram.
-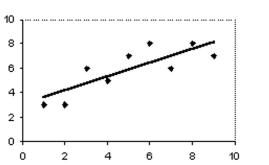 The scatter diagram and best-fit line show the data for the price of a stock (y) and U.S. employment (x) . The correlation coefficient r is 0.8. Predict the stock price for an employment value of 5.
A) 5.9
B) 4.9
C) 7
D) No valid prediction is possible.
Correct Answer:
Verified
Q42: Determine whether the stated causal connection is
Q43: Determine whether the stated causal connection is
Q44: Solve the problem. Round your answers to
Q45: Solve the problem.
-There is a strong correlation
Q46: Solve the problem.
-A local highway has an
Q48: Solve the problem.
-A study found a strong
Q49: Solve the problem.
-A reporter studied the causes
Q50: Answer the question using the value of
Q51: Answer the question using the value of
Q52: Determine whether the stated causal connection is
Unlock this Answer For Free Now!
View this answer and more for free by performing one of the following actions

Scan the QR code to install the App and get 2 free unlocks

Unlock quizzes for free by uploading documents