Use the figure to answer the question.
-The following scatterplot shows the heights (in inches) of a group of children and their ages. 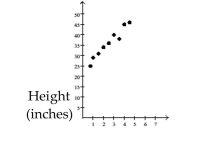 Age (years) From this data, conjecture how old you think a child is who is about 39 inches tall?
A) 1 year
B) 3 months
C) 3 years
D) 7 years
Correct Answer:
Verified
Q46: Construct the requested statistical display.
-The one-day temperatures
Q47: Use the circle graph to solve the
Q48: Identify whether the given scatterplot shows a
Q49: Identify whether the given scatterplot shows a
Q50: Use the figure to answer the question.
-The
Q52: Use the figure to answer the question.
-The
Q53: Use the circle graph to solve the
Q54: Use the figure to answer the question.
-The
Q55: Construct the requested statistical display.
-Kevin asked
Q56: Use the figure to answer the
Unlock this Answer For Free Now!
View this answer and more for free by performing one of the following actions

Scan the QR code to install the App and get 2 free unlocks

Unlock quizzes for free by uploading documents