Use the figure to answer the question.
-The sales figures for the Big "D" Company are shown below in a line graph. 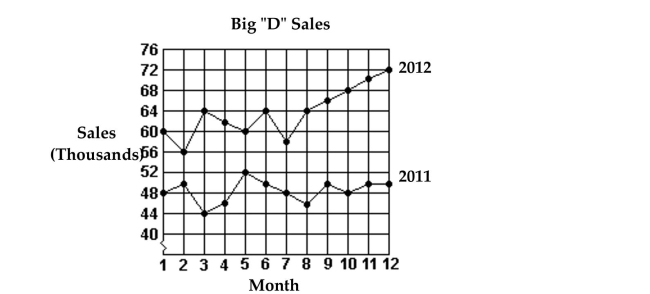 What were the total sales for the first 6 months of 2011?
A) $366,000
B) $240,000
C) $46,000
D) $290,000
Correct Answer:
Verified
Q47: Use the circle graph to solve the
Q48: Identify whether the given scatterplot shows a
Q49: Identify whether the given scatterplot shows a
Q50: Use the figure to answer the question.
-The
Q51: Use the figure to answer the question.
-The
Q53: Use the circle graph to solve the
Q54: Use the figure to answer the question.
-The
Q55: Construct the requested statistical display.
-Kevin asked
Q56: Use the figure to answer the
Q57: Use the figure to answer the question.
-The
Unlock this Answer For Free Now!
View this answer and more for free by performing one of the following actions

Scan the QR code to install the App and get 2 free unlocks

Unlock quizzes for free by uploading documents