Sketch the function represented by the given parametric equations. Then use the graph to determine each of the
following:
a. intervals, if any, on which the function is increasing and intervals, if any, on which the function is decreasing.
b. the number, if any, at which the function has a maximum and this maximum value, or the number, if any, at
which the function has a minimum and this minimum value.
- 
A) Increasing on: 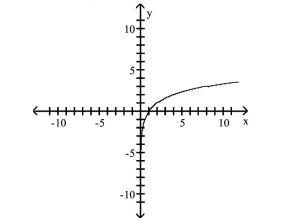
B) Increasing on: ; Minimum: 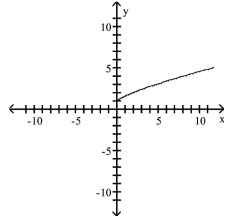
C) Increasing on: 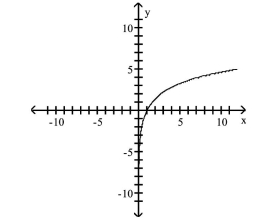
D) Decreasing on: 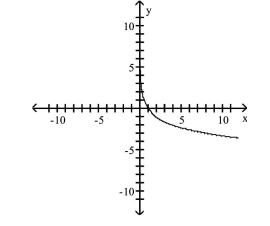
Correct Answer:
Verified
Q200: Eliminate the Parameter Q201: Understand the Advantages of Parametric Representations Q202: Conic Sections in Polar Coordinates Q203: Understand the Advantages of Parametric Representations Q204: Graph the Polar Equations of Conics Q206: Find two sets of parametric equations Q207: Understand the Advantages of Parametric Representations Q208: Conic Sections in Polar Coordinates Q209: Graph the Polar Equations of Conics Q210: Find a set of parametric equations
-
-A
1 Define
-A
-
-Ron
1 Define
-
Unlock this Answer For Free Now!
View this answer and more for free by performing one of the following actions

Scan the QR code to install the App and get 2 free unlocks

Unlock quizzes for free by uploading documents