Multiple Choice
Construct a scatter plot of the data in the table.
- 
A) 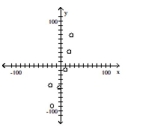
B) 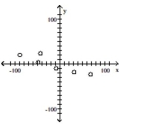
C) 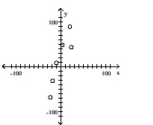
D) 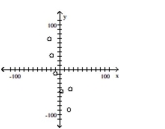
Correct Answer:
Verified
Related Questions
Q68: Construct a scatter plot of the
Q69: Solve the equation for y.
-The temperature
Q70: Solve the equation for y.
-
Q71: Use the data shown in the scatter
Q72: Solve the equation for y.
-When going
Q74: Construct a scatter plot of the
Q75: Solve the equation for y.
-A repair company's
Q76: Without graphing, determine whether the following
Q77: Solve the equation for y.
-The temperature,
Q78: Use the data shown in the scatter
Unlock this Answer For Free Now!
View this answer and more for free by performing one of the following actions

Scan the QR code to install the App and get 2 free unlocks

Unlock quizzes for free by uploading documents