Solve the problem. Where appropriate, round to the nearest tenth of a percent.
-The graph shows the number of cars (in thousands) produced by a car manufacturer in the years 1980, 1985, 1990, 1995, 2000, and 2005. Which five -year period saw the largest percent increase in Production? 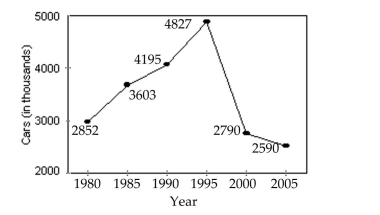
A) 1980 to 1995
B) 1980 to 1985
C) 1995 to 2000
D) 1990 to 1995
Correct Answer:
Verified
Q31: Solve the problem. Round to the nearest
Q32: Solve the problem. Round to the nearest
Q33: Solve the problem. Round to the nearest
Q34: Solve the problem. Where appropriate, round to
Q35: Solve the problem. Where appropriate, round to
Q37: Solve the problem. Where appropriate, round to
Q38: Solve the problem. Where appropriate, round to
Q39: Solve the problem. Where appropriate, round to
Q40: Solve the problem. Where appropriate, round to
Q41: Solve the problem
-A particular car gets fuel
Unlock this Answer For Free Now!
View this answer and more for free by performing one of the following actions

Scan the QR code to install the App and get 2 free unlocks

Unlock quizzes for free by uploading documents