Solve the problem. Where appropriate, round to the nearest tenth of a percent.
-The graph below shows a certain countryʹs peanut production in thousands of pounds for the Years 2004, 2006, 2008, 2010, and 2012. Find the percent increase in peanut production from 2008 to 2010. 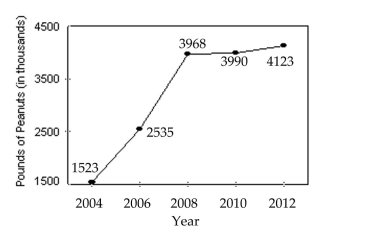
A) 0.0060%
B) 0.6%
C) 3.3%
D) 0.0330%
Correct Answer:
Verified
Q33: Solve the problem. Round to the nearest
Q34: Solve the problem. Where appropriate, round to
Q35: Solve the problem. Where appropriate, round to
Q36: Solve the problem. Where appropriate, round to
Q37: Solve the problem. Where appropriate, round to
Q39: Solve the problem. Where appropriate, round to
Q40: Solve the problem. Where appropriate, round to
Q41: Solve the problem
-A particular car gets fuel
Q42: Find the simple interest. (The rate is
Q43: Find the simple interest. (The rate is
Unlock this Answer For Free Now!
View this answer and more for free by performing one of the following actions

Scan the QR code to install the App and get 2 free unlocks

Unlock quizzes for free by uploading documents