Solve the problem.
-Use the following graph which shows the number of customer service calls to a major appliance Manufacturer, in millions, for the years 2006-2012. Use the graph to represent the set in roster Form. 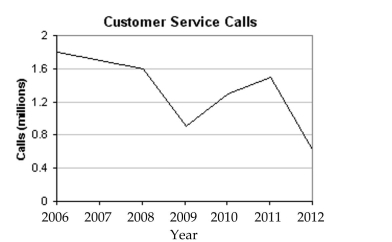
The set of years in which the number of customer service calls were below 1.1 million.
A) {2009, 2010, 2012}
B) {2009, 2012}
C) {2008, 2009, 2012}
D) {2012}
Correct Answer:
Verified
Q30: Express the set in roster form.
-The set
Q31: Solve the problem.
-Use the following table,
Q32: Express the set in roster form.
-{x|x is
Q33: Express the set in roster form.
-The set
Q34: Express the set in roster form.
-{x|x is
Q36: Express the set in roster form.
-{x|x is
Q37: Solve the problem.
-Use the following graph, which
Q38: Solve the problem.
-Use the following table,
Q39: Solve the problem.
-Use the following table,
Q40: Express the set in roster form.
-The set
Unlock this Answer For Free Now!
View this answer and more for free by performing one of the following actions

Scan the QR code to install the App and get 2 free unlocks

Unlock quizzes for free by uploading documents