Solve the problem.
-Use the following graph, which shows the sales of digital music players, in millions, at a national Electronics retail store for the years 2005-2012. Use the graph to represent the set in roster form. 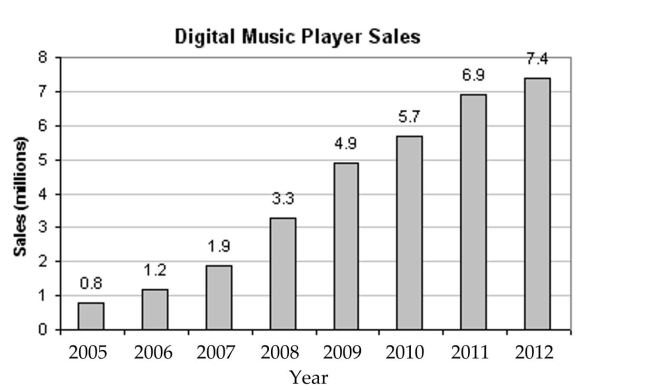
The set of years included in the graph in which digital music player sales were more than 18 Million.
A) {2005, 2006, 2007, 2008, 2009, 2010, 2011}
B) {0}
C) { }
D) {2005, 2006, 2007, 2008, 2009, 2010, 2011, 2012}
Correct Answer:
Verified
Q32: Express the set in roster form.
-{x|x is
Q33: Express the set in roster form.
-The set
Q34: Express the set in roster form.
-{x|x is
Q35: Solve the problem.
-Use the following graph which
Q36: Express the set in roster form.
-{x|x is
Q38: Solve the problem.
-Use the following table,
Q39: Solve the problem.
-Use the following table,
Q40: Express the set in roster form.
-The set
Q41: Write the set in set-builder notation.
-{48, 54,
Q42: Tell whether the statement is true or
Unlock this Answer For Free Now!
View this answer and more for free by performing one of the following actions

Scan the QR code to install the App and get 2 free unlocks

Unlock quizzes for free by uploading documents