Solve the problem.
-The following figure represents the average hourly wage for employees of MegaMart from 1980 to 2005. 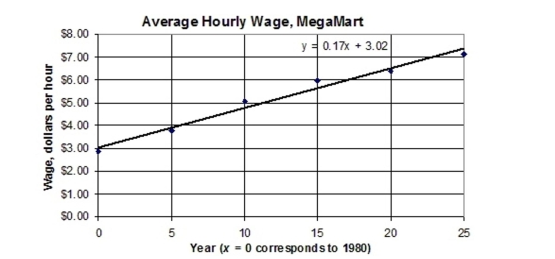
Let represent the hourly wage and let represent the year, where corresponds to the year represents 1981 , and so on. Then the average wage can be approximated by the equation , where . Use the linear equation to approximate the average wage for the year 1,985 and compare it to the act wage of per hour.
A) per hour; the calculated wage was less than the actual wage.
B) per hour; the calculated wage was more than the actual wage.
C) per hour; the calculated wage was more than the actual wage.
D) per hour; the calculated wage was more than the actual wage.
Correct Answer:
Verified
Q229: Compute the least-squares regression line for
Q230: Solve the problem.
-The graph shows the
Q231: Solve the problem.
-A tumor originally weighed
Q232: Plot the point on a rectangular
Q233: Solve the problem.
-A bakery makes and sells
Q235: Solve the problem.
-A pediatrician records the
Q236: Compute the least-squares regression line for
Q237: Solve the problem.
-The data in the
Q238: Write an equation of the line
Q239: Compute the least-squares regression line for
Unlock this Answer For Free Now!
View this answer and more for free by performing one of the following actions

Scan the QR code to install the App and get 2 free unlocks

Unlock quizzes for free by uploading documents