Plot the point on a rectangular coordinate system.
-The figure represents the average credit card debt for selected households in Silerville. 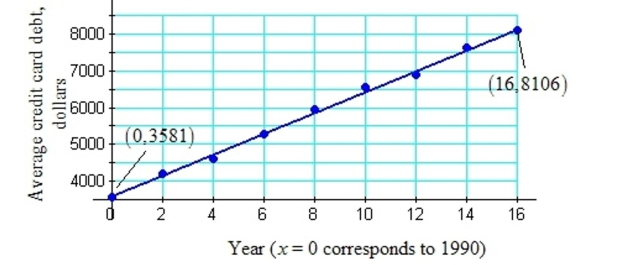
Let y represent the credit card debt in dollars. Let x represent the year, where x = 0 corresponds to the year 1990, x = 4 represents 1994, and so on.
a. Use the ordered pairs given in the graph, (0, 3581) and (16, 8106) to find a linear equation to estimate the
Average credit card debt versus the year. Round the slope to the nearest tenth.
b. Use the model from (a) to estimate the average debt in 2003. Round to the nearest dollar.
c. Interpret the slope of the model in the context of this problem.
A) a.
b. in 2003
c. The average household credit card debt is increasing at approximately per year.
B) а.
b. in 2003
c. The average household credit card debt is increasing at approximately per year.
C) a.
b. in 2003
c. The average household credit card debt is decreasing at approximately per year.
D) a.
b. in 2003
c. The average household credit card debt is decreasing at approximately per year.
Correct Answer:
Verified
Q227: Write an equation of the line satisfying
Q228: Solve the problem.
-Joey borrows $2,400 from his
Q229: Compute the least-squares regression line for
Q230: Solve the problem.
-The graph shows the
Q231: Solve the problem.
-A tumor originally weighed
Q233: Solve the problem.
-A bakery makes and sells
Q234: Solve the problem.
-The following figure represents
Q235: Solve the problem.
-A pediatrician records the
Q236: Compute the least-squares regression line for
Q237: Solve the problem.
-The data in the
Unlock this Answer For Free Now!
View this answer and more for free by performing one of the following actions

Scan the QR code to install the App and get 2 free unlocks

Unlock quizzes for free by uploading documents