Wagenlucht Ice Cream Company is always trying to create new flavors of ice cream. They are market testing three kinds to find out which one has the best chance of becoming popular. They give small samples of each to 20 people at a grocery store. Four ice cream Tasters preferred the Strawberry Cream, 12 preferred Choco-Nuts, and four loved the Orange Mint. Construct a Pareto chart to represent these preferences. Choose the vertical Scale so that the relative frequencies are represented.
A) Ice Cream Preference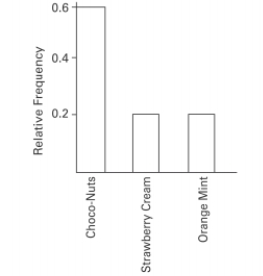
B) Ice Cream Preference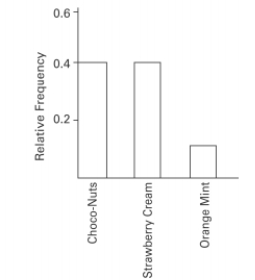
C) Ice Cream Preference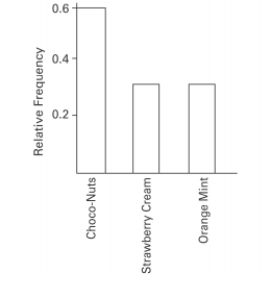
D) Ice Cream Preference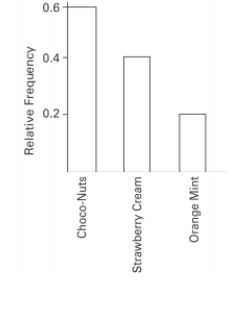
Correct Answer:
Verified
Q16: Q17: The following frequency distribution represents the Q18: The attendance counts for this season's Q19: The histogram below represents the number of Q20: The Kappa Iota Sigma Fraternity polled its Q22: A nurse measured the blood pressure Q23: The frequency distribution below summarizes the Q24: The histogram below represents the number of Q25: Attendance records at a school show Q26: The Kappa Iota Sigma Fraternity polled its
Unlock this Answer For Free Now!
View this answer and more for free by performing one of the following actions

Scan the QR code to install the App and get 2 free unlocks

Unlock quizzes for free by uploading documents