The histogram below represents the number of television sets per household for a sample of U.S. households. What is the sample size? Number of TV Sets Per U.S. Household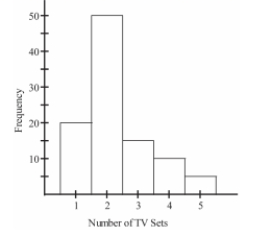
A) 5
B) 50
C) 90
D) 100
Correct Answer:
Verified
Q19: The histogram below represents the number of
Q20: The Kappa Iota Sigma Fraternity polled its
Q21: Wagenlucht Ice Cream Company is always trying
Q22: A nurse measured the blood pressure
Q23: The frequency distribution below summarizes the
Q25: Attendance records at a school show
Q26: The Kappa Iota Sigma Fraternity polled its
Q27: A nurse measured the blood pressure
Q28: Smoking and the episodes of lung cancer
Q29: The following frequency distribution displays the
Unlock this Answer For Free Now!
View this answer and more for free by performing one of the following actions

Scan the QR code to install the App and get 2 free unlocks

Unlock quizzes for free by uploading documents