Figure 21-3
In each case, the budget constraint moves from BC1 to BC2.
Graph (a)
Graph (b)
Graph (c)
Graph (d) 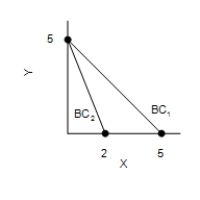
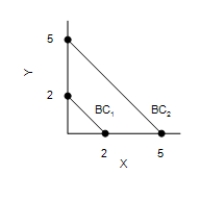
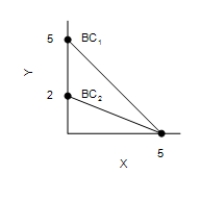
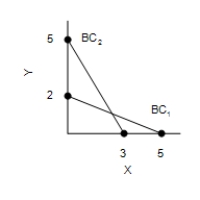
-Refer to Figure 21-3. Which of the graphs in the figure could reflect a simultaneous increase in the price of good X and decrease in the price of good Y?
A) Graph (a)
B) Graph (b)
C) Graph (c)
D) Graph (d)
Correct Answer:
Verified
Q97: Figure 21-18
The figure shows two indifference curves
Q98: Figure 21-18
The figure shows two indifference curves
Q99: For Meg, the substitution effect of an
Q100: For Molly, the substitution effect of a
Q101: Evaluate the following statement, "Warren Buffet is
Unlock this Answer For Free Now!
View this answer and more for free by performing one of the following actions

Scan the QR code to install the App and get 2 free unlocks

Unlock quizzes for free by uploading documents