Figure 21-2
In each case, the budget constraint moves from BC1 to BC2.
Graph (a)
Graph (b)
Graph (c)
Graph (d) 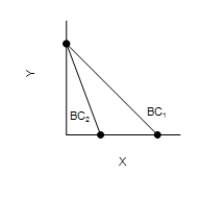
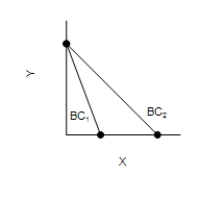
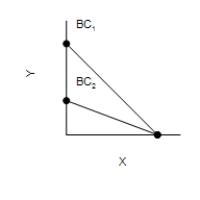
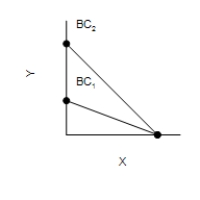
-Refer to Figure 21-2. Which of the graphs in the figure reflects an increase in the price of good X only?
A) Graph (b)
B) Graph (a)
C) Graph (c)
D) Graph (d)
Correct Answer:
Verified
Q99: For Meg, the substitution effect of an
Q100: For Molly, the substitution effect of a
Q101: Evaluate the following statement, "Warren Buffet is
Q102: Figure 21-3
In each case, the budget constraint
Q103: Figure 21-1 Q105: Using the graph shown, construct a demand Q106: Assume that a person consumes two goods, Q107: The theory of consumer choice provides the Q108: Explain the relationship between the budget constraint Q109: Figure 21-1 ![]()
![]()
Unlock this Answer For Free Now!
View this answer and more for free by performing one of the following actions

Scan the QR code to install the App and get 2 free unlocks

Unlock quizzes for free by uploading documents