The following scatterplot shows output/unit capital and years.The data show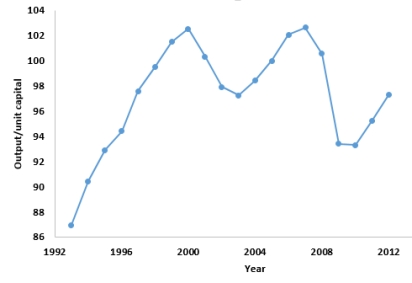
A) There is no consistent increasing or decreasing over time.
B) There is no evidence of a seasonal component.
C) There is some evidence of a cyclical component.
D) There is no linear trend over the time period.
E) All of the above.
Correct Answer:
Verified
Q71: Based on the actual and forecasted returns
Q72: The U.S.Bureau of Labor Statistics publishes the
Q73: The results of a multiple regression model
Q74: The time series graph below shows monthly
Q75: Use a single exponential smoothing (SES) model
Q77: The Durbin-Watson statistic for a regression model
Q78: According to the following regression analysis, the
Q79: A farmer has increased his wheat production
Q80: Using the following regression analysis of the
Q81: A recent report evaluated the price and
Unlock this Answer For Free Now!
View this answer and more for free by performing one of the following actions

Scan the QR code to install the App and get 2 free unlocks

Unlock quizzes for free by uploading documents