The time series graph below shows monthly sales figures for a specialty gift item sold on the Home Shopping Network (HSN) .The dominant component in these data is ________________________ .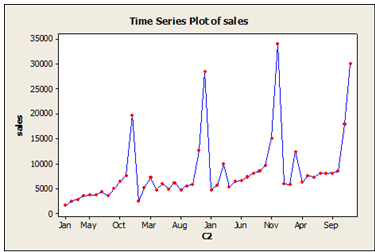
A) Cyclical
B) Seasonal
C) Randomness
D) Irregular
E) Error
Correct Answer:
Verified
Q69: A recent survey of online shoppers asked
Q70: According to the multiple regression model to
Q71: Based on the actual and forecasted returns
Q72: The U.S.Bureau of Labor Statistics publishes the
Q73: The results of a multiple regression model
Q75: Use a single exponential smoothing (SES) model
Q76: The following scatterplot shows output/unit capital and
Q77: The Durbin-Watson statistic for a regression model
Q78: According to the following regression analysis, the
Q79: A farmer has increased his wheat production
Unlock this Answer For Free Now!
View this answer and more for free by performing one of the following actions

Scan the QR code to install the App and get 2 free unlocks

Unlock quizzes for free by uploading documents