Multiple Choice
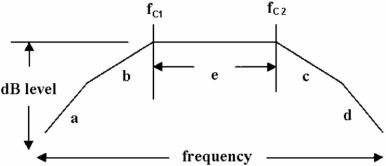
-The graph of dB level vs frequency is called a .
A) Body graph
B) Body plot
C) Bode plot
D) All of the above.
Correct Answer:
Verified
Related Questions
-The graph of dB level vs frequency is called a .
A) Body graph
B) Body plot
C) Bode plot
D) All of the above.
Correct Answer:
Verified

