The graph below represents the rate of change of a function f with respect to x; i.e., it is a graph of f '.You are told that f (0) = 0.What can you say about
at the point x = 1.3? Mark all that apply. 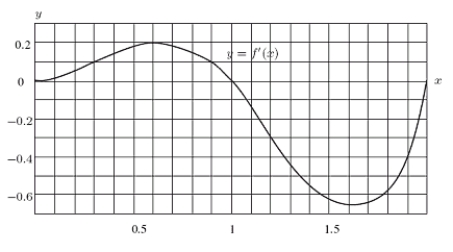
A) is decreasing.
B)
is increasing.
C)
is concave up.
D)
is concave down.
Correct Answer:
Verified
Q37: Use the definition of the derivative
Q38: What is the equation of the
Q39: Could the first graph, A be the
Q40: Consider the function y = f(x)graphed
Q41: A function defined for all x
Q43: Let L(r)be the amount of board-feet of
Q44: The graph of
Q45: The graph below gives the position of
Q46: Esther is a swimmer who prides
Q47: Given the following data about a
Unlock this Answer For Free Now!
View this answer and more for free by performing one of the following actions

Scan the QR code to install the App and get 2 free unlocks

Unlock quizzes for free by uploading documents