The graph of
is given in the following figure.What happens to
at the point
? 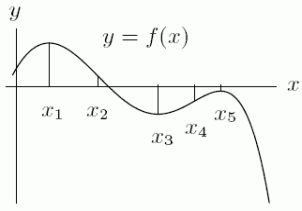

A)
has an inflection point.
B)
has a local minimum or maximum.
C)
changes sign.
D) none of the above
Correct Answer:
Verified
Q39: Could the first graph, A be the
Q40: Consider the function y = f(x)graphed
Q41: A function defined for all x
Q42: The graph below represents the rate
Q43: Let L(r)be the amount of board-feet of
Q45: The graph below gives the position of
Q46: Esther is a swimmer who prides
Q47: Given the following data about a
Q48: Let t(h)be the temperature in degrees Celsius
Q49: On the axes below, sketch a smooth,
Unlock this Answer For Free Now!
View this answer and more for free by performing one of the following actions

Scan the QR code to install the App and get 2 free unlocks

Unlock quizzes for free by uploading documents