The figure below shows the graph of the velocity, v, of an object (in meters/sec.) .If the graph were shifted up two units, what would it mean for the motion of the object? 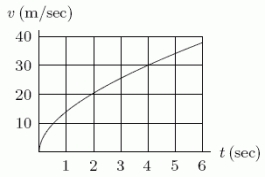
A) The velocity at each time would be 2 m/sec greater.
B) The velocity at each time would be 12 m/sec greater.
C) The velocity at each time would be 20 m/sec greater.
D) The velocity at each time would be 120 m/sec greater.
E) The velocity at each time would be the same.
Correct Answer:
Verified
Q1: Estimate Q2: At time t, in seconds, the Q3: Consider the region A shown in the Q4: At time t, in seconds, your Q6: What does the following figure represent? Q7: Consider a sports car which accelerates Q8: Two greyhound racing dogs, A and B, Q9: At time t, in seconds, your Q10: Estimate the area of the region Q11: The figure below shows the graph of
Unlock this Answer For Free Now!
View this answer and more for free by performing one of the following actions

Scan the QR code to install the App and get 2 free unlocks

Unlock quizzes for free by uploading documents