The figure below shows the graph of the velocity, v, of an object (in meters/sec.) .If the graph were shifted up 4 units, how would the total distance traveled between t = 0 and t = 6 change? 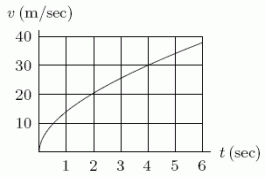
A) It would increase by 4 units.
B) It would increase by 24 units.
C) It would remain the same.
D) It would decrease by 4 units.
E) It would decrease by 24 units.
Correct Answer:
Verified
Q6: What does the following figure represent?
Q7: Consider a sports car which accelerates
Q8: Two greyhound racing dogs, A and B,
Q9: At time t, in seconds, your
Q10: Estimate the area of the region
Q12: Use the table to estimate
Q13: The graph shown below is that of
Q14: A car is observed to have
Q15: If an upper estimate of the area
Q16: At time t, in seconds, your
Unlock this Answer For Free Now!
View this answer and more for free by performing one of the following actions

Scan the QR code to install the App and get 2 free unlocks

Unlock quizzes for free by uploading documents