Multiple Choice
Figure 10-19 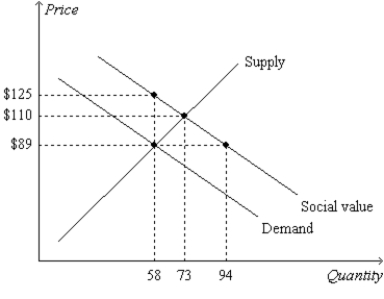
-Refer to Figure 10-19. The socially optimal quantity of output is
A) 58 units.
B) 73 units.
C) between 73 and 94 units.
D) 94 units.
Correct Answer:
Verified
Related Questions
Q232: Which of the following policies is not
Q233: Figure 10-19 Q234: Figure 10-18. The graph represents a corrective Q235: Figure 10-19 Q236: Which of the following statements is correct Unlock this Answer For Free Now! View this answer and more for free by performing one of the following actions Scan the QR code to install the App and get 2 free unlocks Unlock quizzes for free by uploading documents![]()
![]()

