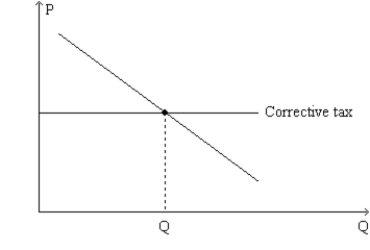
Figure 10-18. The graph represents a corrective tax to reduce pollution. On the axes, Q denotes the quantity of pollution and P represents the price of pollution. 
-Refer to Figure 10-18. The tax depicted on the graph
A) gives polluting firms an incentive to develop cleaner technologies.
B) is viewed by most economists as less effective than a command-and-control policy as a means of reducing pollution.
C) has the effect of moving the allocation of resources further from the social optimum than it would be in the absence of the tax.
D) All of the above are correct.
Correct Answer:
Verified
Q229: In summarizing the research on the externalities
Q230: Which of the following statements is true
Q231: Figure 10-18. The graph represents a corrective
Q232: Which of the following policies is not

