The cost graphs below show various types of cost behaviors.For each of the following costs, identify the cost graph that best describes its cost behavior as the number of units produced and sold increases: 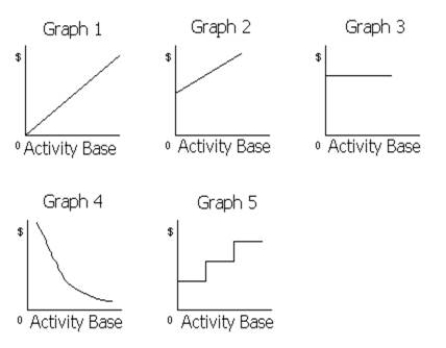 (a)Sales commissions of $6,000 plus $0.05 for each item sold
(b)Rent on warehouse of $12,000 per month
(c)Insurance costs of $2,500 per month
(d)Per-unit cost of direct labor
(e)Total salaries of quality control supervisors
(One supervisor must be added for each additional work shift.)
(f)Total employer pension costs of $0.35 per direct labor hour
(g)Per-unit straight-line depreciation costs
(h)Per-unit cost of direct materials
(i)Total direct materials cost
(j)Electricity costs of $5,000 per month plus $0.0004 per kilowatt-hour
(k)Per-unit cost of plant superintendent's salary
(l)Salary of the night-time security guard of $3,800 per month
(m)Repairs and maintenance costs of $3,000 for each 2,000 hours of factory machine usage
(n)Total direct labor cost
(o)Straight-line depreciation on factory equipment
Correct Answer:
Verified
Q180: Match the following terms (a-e) with their
Q181: Mia Enterprises sells a product for $90
Q182: The manufacturing costs of Mocha Industries for
Q183: Penny Company sells 25,000 units at $59
Q184: Consider the following information:?Variable cost per unit
Q186: Atlantic Company sells a product with a
Q187: Copper Hill Inc. manufactures laser printers within
Q188: The following is a list of various
Q189: Douglas Company has a contribution margin ratio
Q190: Blane Company has the following data:Total sales$800,000Total
Unlock this Answer For Free Now!
View this answer and more for free by performing one of the following actions

Scan the QR code to install the App and get 2 free unlocks

Unlock quizzes for free by uploading documents