The graph shows the volume of wood produced in a single-species forest.Here  is measured in cubic meters/hectare and t is measured in years.By computing the slopes of the respective tangent lines, estimate the rate at which the wood grown is changing at the beginning of year 10 and at the beginning of year 40.
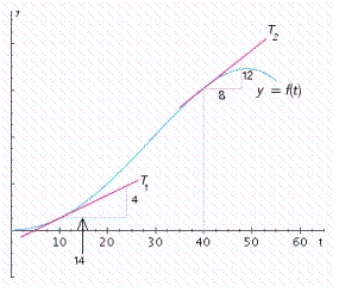
Correct Answer:
Verified
Q26: Let Q27: Use the four-step process to find the Q28: Use the four-step process to find the Q29: At a temperature of Q30: Use the four-step process to find the Q32: During the construction of a high-rise building, Q33: Let Q34: In the following figure, Q35: Productivity and yield of cultivated crops are Q36: Determine all values of x at which Unlock this Answer For Free Now! View this answer and more for free by performing one of the following actions Scan the QR code to install the App and get 2 free unlocks Unlock quizzes for free by uploading documents![]()
![]()
![]()
![]()

