In the following figure,  gives the population
  of a certain bacteria culture at time t after a portion of bactericide A was introduced into the population at
  .The graph of g gives the population
  of a similar bacteria culture at time t after a portion of bactericide B was introduced into the population at
  .
. 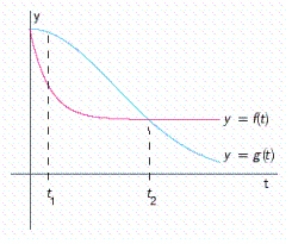 Which population is decreasing faster at
  and at
  ?
?
A) The populations are decreasing at the same rate at  ,
, is decreasing faster at
B)  is decreasing faster at
  ,
, is decreasing faster at
C)  is decreasing faster at
  , the populations are decreasing at the same rate at
D)  is decreasing faster at
  ,
, is decreasing faster at
Correct Answer:
Verified
Q29: At a temperature of Q30: Use the four-step process to find the Q31: The graph shows the volume of wood Q32: During the construction of a high-rise building,![]()

Unlock this Answer For Free Now!
View this answer and more for free by performing one of the following actions

Scan the QR code to install the App and get 2 free unlocks

Unlock quizzes for free by uploading documents