Use the following to answer questions 16-17:
Figure 13.3 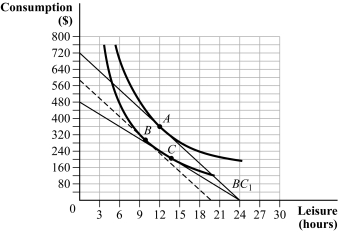
-(Figure 13.3) The figure shows budget constraints and indifference curves for a representative individual. Identify the income effect of the increase in the wage rate in the associated graph.
A) C to B
B) B to C
C) A to C
D) A to B
Correct Answer:
Verified
Q16: Use the following to answer questions 8-11:
Figure
Q18: Use the following to answer questions 8-11:
Figure
Q19: Use the following to answer questions 5-7:
Table
Q19: Assume there is a decrease in the
Q21: The government offers subsidies to homeowners for
Q25: Use the following to answer questions 40-42:
Figure
Q28: If MRPL = W, then the firm:
A)
Q60: In the market for unimproved land, supply
Q68: A backward-bending labor supply curve occurs when:
A)
Q74: In the long run, a firm's decision
Unlock this Answer For Free Now!
View this answer and more for free by performing one of the following actions

Scan the QR code to install the App and get 2 free unlocks

Unlock quizzes for free by uploading documents