Use the following to answer questions 8-11:
Figure 13.1 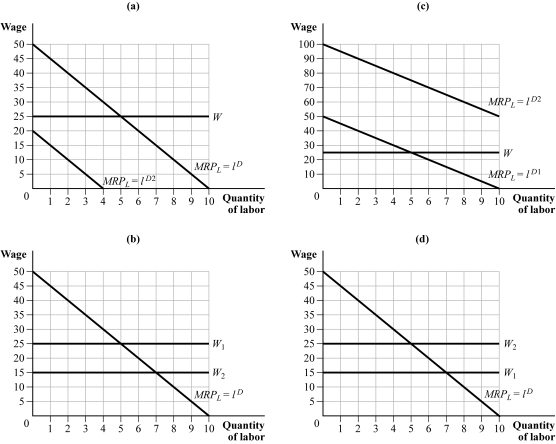
-(Figure 13.1) There is a decrease in total factor productivity. Which graph best illustrates this change?
A) (a)
B) (b)
C) (c)
D) (d)
Correct Answer:
Verified
Q11: Compass Rose Landscaping operates in a very
Q12: Use the following to answer questions 5-7:
Table
Q14: Use the following to answer questions 19-20:
Table
Q18: Use the following to answer questions 8-11:
Figure
Q19: Use the following to answer questions 5-7:
Table
Q20: Use the following to answer questions 16-17:
Figure
Q21: The government offers subsidies to homeowners for
Q26: For a given labor demand curve, which
Q28: If MRPL = W, then the firm:
A)
Q68: A backward-bending labor supply curve occurs when:
A)
Unlock this Answer For Free Now!
View this answer and more for free by performing one of the following actions

Scan the QR code to install the App and get 2 free unlocks

Unlock quizzes for free by uploading documents