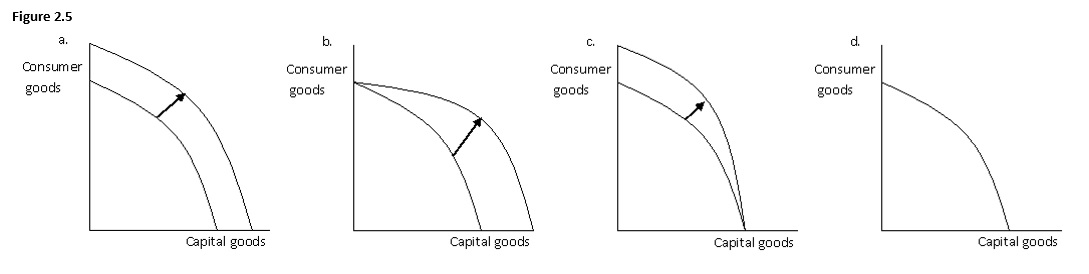
-The figure given below has four graphs showing the production possibilities frontier for capital goods and consumer goods.Which of the graphs below best illustrates the impact on the production possibilities frontier of a decrease in unemployment?
A) a.
B) b.
C) c.
D) d.
E) b and d.
Correct Answer:
Verified
Q85: The figure given below shows the production
Q86: Any movement along a bowed-out production possibilities
Q87: The figure given below shows the production
Q88: A downward-sloping straight-line production possibilities frontier indicates:
A)that
Q90: Which of the following would shift the
Q91: Which of the following would shift the
Q93: On a bowed-out production possibilities frontier showing
Q121: On a straight-line production possibilities frontier, which
Q127: If the production possibilities frontier is a
Q155: On a production possibilities frontier, the opportunity
Unlock this Answer For Free Now!
View this answer and more for free by performing one of the following actions

Scan the QR code to install the App and get 2 free unlocks

Unlock quizzes for free by uploading documents