The figure given below shows the production possibilities frontier for Good A and Good B.In the figure below,when moving from point f to point g,the production of: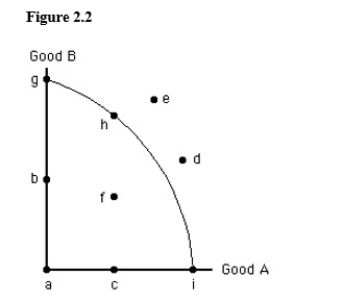
A) Good B increases without a change in the production of Good A.
B) Good A increases without a change in the production of Good B.
C) both Good A and Good B increase.
D) both Good A and Good B decrease.
E) Good B increases and the production of Good A decreases.
Correct Answer:
Verified
Q82: As resources are not perfectly adaptable to
Q85: The figure given below shows the production
Q86: Any movement along a bowed-out production possibilities
Q88: A downward-sloping straight-line production possibilities frontier indicates:
A)that
Unlock this Answer For Free Now!
View this answer and more for free by performing one of the following actions

Scan the QR code to install the App and get 2 free unlocks

Unlock quizzes for free by uploading documents