The graph in the following figure gives the times that it takes a vehicle to reach speeds from 0 mph to 25 mph, in increments of 5 mph, with a curve connecting them. Count the squares under the curve to estimate this distance. Estimate the distance traveled by the vehicle in 14 seconds, to a speed of 25 mph. (Be careful with time units.) 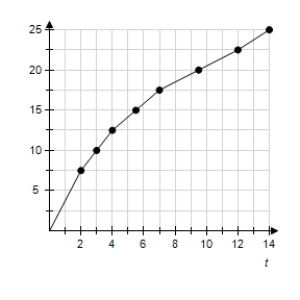
A) 1/16 mile
B) 4/15 mile
C) 1/13 mile
D) 1/9 mile
E) 1/8 mile
Correct Answer:
Verified
Q2: Use the sum formulas to find the
Q3: Use rectangles to find the area between
Q4: Approximate the area under the curve defined
Q5: Find the numerical value of 
Q6: When the area under Q8: Use the function Q9: Find the numerical value of Q10: When the area under Q11: The following table shows the rate of Q12: Approximate the area under the curve over Unlock this Answer For Free Now! View this answer and more for free by performing one of the following actions Scan the QR code to install the App and get 2 free unlocks Unlock quizzes for free by uploading documents![]()
![]()
![]()

