The following table shows the rate of oil consumption (in thousands of barrels per year) by a certain city. Estimate the total consumption of oil by the city from 1999 -2004 by using 5 equal subdivisions and left-hand endpoints to estimate the area under the graph that corresponds to the table from 1999 to 2004. 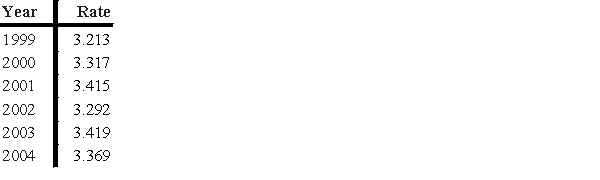
A) 17.708 thousand barrels
B) 16.656 thousand barrels
C) 16.812 thousand barrels
D) 17.606 thousand barrels
E) 15.733 thousand barrels
Correct Answer:
Verified
Q6: When the area under Q7: The graph in the following figure gives Q8: Use the function Q9: Find the numerical value of Unlock this Answer For Free Now! View this answer and more for free by performing one of the following actions Scan the QR code to install the App and get 2 free unlocks Unlock quizzes for free by uploading documents![]()
![]()


