The figure below is the graph of the demand function D, the supply function S, and the supply function after a $30 tax T for the same product. Is it possible for the government to earn no money if it keeps increasing taxes on this product? 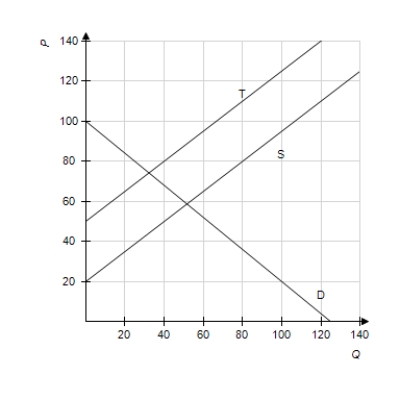
A) Yes
B) No
Correct Answer:
Verified
Q233: Retailers will buy 45 cordless phones from
Q234: A manufacturer sells watches for $75 per
Q235: The figure below is the graph of
Q236: If the demand and supply functions for
Q237: Find the market equilibrium point for the
Q238: A manufacturer of DVD players has monthly
Q240: A company distributes college logo sweatshirts and
Q241: Suppose that in a certain market, the
Q242: Suppose that a certain product has the
Q243: Suppose that a certain product has the
Unlock this Answer For Free Now!
View this answer and more for free by performing one of the following actions

Scan the QR code to install the App and get 2 free unlocks

Unlock quizzes for free by uploading documents