The figure below is the graph of both the demand function D and the supply function S for the same product, where P is the price per unit and Q is the number of units produced. Will there be a market surplus or shortage when the price P is $250? 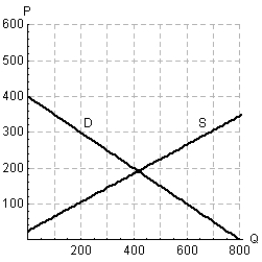
A) There will be a market shortage.
B) There will be a market surplus.
Correct Answer:
Verified
Q230: The figure below show the demand and
Q231: Assume that the price for a pair
Q232: As the price of a commodity decreases,
Q233: Retailers will buy 45 cordless phones from
Q234: A manufacturer sells watches for $75 per
Q236: If the demand and supply functions for
Q237: Find the market equilibrium point for the
Q238: A manufacturer of DVD players has monthly
Q239: The figure below is the graph of
Q240: A company distributes college logo sweatshirts and
Unlock this Answer For Free Now!
View this answer and more for free by performing one of the following actions

Scan the QR code to install the App and get 2 free unlocks

Unlock quizzes for free by uploading documents