The data below represents monthly sales for two years of beanbag animals at a local retail store (Month 1 represents January and Month 12 represents December). Given the time series plot below, do you see any obvious patterns in the data? Explain. 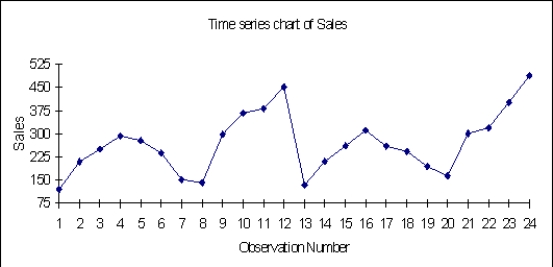
Correct Answer:
Verified
View Answer
Unlock this answer now
Get Access to more Verified Answers free of charge
Q23: The core purpose of time series graphs
Q39: Time series graphs chart the values of
Q61: Where will you find "time" on a
Q90: Researchers are conducting a review of the
Q91: Based on the histogram shown below, how
Q92: In a generic box plot, the asterisk
Q93: Seventy percent of the job applicants scored
Q94: Because they represent such extreme values, outliers
Q95: Is the distribution of the number of
Q99: The histogram below represents scores achieved by
Unlock this Answer For Free Now!
View this answer and more for free by performing one of the following actions

Scan the QR code to install the App and get 2 free unlocks

Unlock quizzes for free by uploading documents