There were approximately 42 million unemployed workers in the United States.The circle graph shows the age profile of these unemployed workers.What is the probability that a person selected at random from the population of unemployed workers is 45 or older? ( and ) 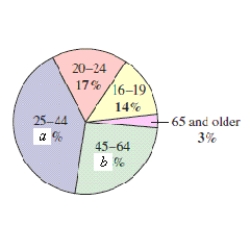
A)
B)
C)
D)
E) 42
Correct Answer:
Verified
Q31: The figure shows the results of
Q32: The figure shows the results of
Q33: Find the probability for the experiment
Q34: The educational attainment of a country population
Q35: The educational attainment of a country
Q37: The figure shows the results of
Q38: You are given the probability
Q39: The educational attainment of a country
Q40: Find the probability for the
Q45: In a sample of 20 hand-held calculators,15
Unlock this Answer For Free Now!
View this answer and more for free by performing one of the following actions

Scan the QR code to install the App and get 2 free unlocks

Unlock quizzes for free by uploading documents