The graph shows the numbers of performers who were elected to the Rock and Roll Hall of Fame from 1991 through 2008.Describe any trends in the data.From these trends, predict the number of performers elected in 2009. 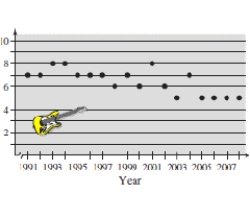
A) The number of performers elected in last four years in the graph seems to be nearly steady except for the first few years therefore five performers will be elected in 2009.
B) The number of performers elected in last four years in the graph seems to be nearly steady except for the first few years therefore seven performers will be elected in 2009.
C) The number of performers elected in last four years in the graph seems to be nearly steady except for the first few years therefore eight performers will be elected in 2009.
D) The number of performers elected in last four years in the graph seems to be nearly steady except for the first few years therefore six performers will be elected in 2009.
E) The number of performers elected in last four years in the graph seems to be nearly steady except for the first few years therefore nine performers will be elected in 2009.
Correct Answer:
Verified
Q21: Find the distance between the points.(Round the
Q31: Given points(-1,1),and (-11,-9)form the vertices of the
Q38: Given the points (-6,-8)and (4,-6).Find a third
Q47: Find the coordinates of the vertices of
Q448: Plot the following points and find the
Q450: Show that the points form the
Q454: Use the graph, which shows the average
Q455: Plot the following points and find
Q456: Plot the following points and find the
Q457: Show that the points form the
Unlock this Answer For Free Now!
View this answer and more for free by performing one of the following actions

Scan the QR code to install the App and get 2 free unlocks

Unlock quizzes for free by uploading documents