Use the graph, which shows the average retail prices of 1 gallon of whole milk from 1996 through 2007. 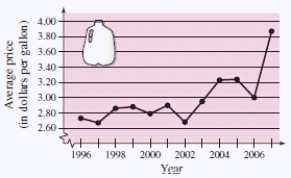
Approximate the percent change in the price of milk from the price in 2000 to the highest price shown in the graph.
A) About 48%
B) About 58%
C) About 43%
D) About 53%
E) About 38%
Correct Answer:
Verified
Q21: Find the distance between the points.(Round the
Q31: Given points(-1,1),and (-11,-9)form the vertices of the
Q47: Find the coordinates of the vertices of
Q53: A quarterback is standing in the middle
Q450: Show that the points form the
Q452: The graph shows the numbers of performers
Q455: Plot the following points and find
Q456: Plot the following points and find the
Q457: Show that the points form the
Q459: Use the graph, which shows the average
Unlock this Answer For Free Now!
View this answer and more for free by performing one of the following actions

Scan the QR code to install the App and get 2 free unlocks

Unlock quizzes for free by uploading documents