The graph shows the sales (in billions of dollars) for Apple Inc.for the years 2001 through 2007. 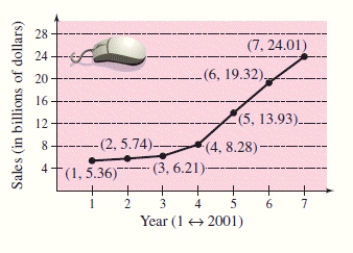 Find the slope of the line segment connecting the points for the years 2003 and 2004.Round the answer to two decimal places.
A) -5.07
B) 2.07
C) 7.07
D) 3.07
E) -2.07
Correct Answer:
Verified
Q58: Find the slope of the line passing
Q332: You are driving on a road
Q333: Use the intercept form to find
Q334: A microchip manufacturer pays its assembly
Q335: Determine whether the lines are parallel,
Q336: The graph shows the average salaries for
Q338: Use the intercept form to find
Q339: A discount outlet is offering a
Q340: A pharmaceutical salesperson receives a monthly
Q342: Write the equation of the line
Unlock this Answer For Free Now!
View this answer and more for free by performing one of the following actions

Scan the QR code to install the App and get 2 free unlocks

Unlock quizzes for free by uploading documents