Use the survivorship curves in the figure to answer the following question.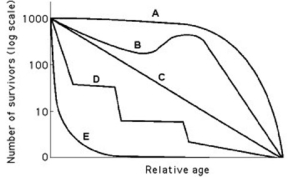
Which statement best explains survivorship curve B?
A) It is likely a species that provides little postnatal care, but lots of care for offspring during midlife as indicated by increased survivorship.
B) This curve is likely for a species that produces lots of offspring, only a few of which are expected to survive.
C) It is likely a species where no individuals in the cohort die when they are at 60-70% relative age.
D) Survivorship can only decrease; therefore, this curve could not happen in nature.
Correct Answer:
Verified
Q11: Use the figure to answer the following
Q12: Which of the following examples would most
Q13: Which of the following is the most
Q14: Which of the following scenarios would provide
Q15: Use the survivorship curves in the figure
Q17: Use the graph to answer the following
Q18: Which of the following groups would be
Q19: Use the graph to answer the following
Q20: Use the table to answer the following
Q21: You observe two breeding female fish of
Unlock this Answer For Free Now!
View this answer and more for free by performing one of the following actions

Scan the QR code to install the App and get 2 free unlocks

Unlock quizzes for free by uploading documents