Use the graph to answer the following question.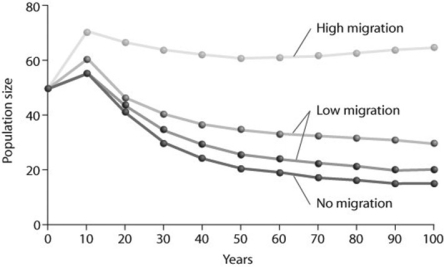
Looking at the figure, what factor is contributing significantly to stabilizing the population size over time?
I. no migration
II. low migration
III.high migration
A) only I
B) only II
C) only III
D) only II and III
Correct Answer:
Verified
Q14: Which of the following scenarios would provide
Q15: Use the survivorship curves in the figure
Q16: Use the survivorship curves in the figure
Q17: Use the graph to answer the following
Q18: Which of the following groups would be
Q20: Use the table to answer the following
Q21: You observe two breeding female fish of
Q22: What is the primary limiting factor that
Q23: In 2008, the population of New Zealand
Q24: Consider two old-growth forests: One is undisturbed
Unlock this Answer For Free Now!
View this answer and more for free by performing one of the following actions

Scan the QR code to install the App and get 2 free unlocks

Unlock quizzes for free by uploading documents